Back to news
AnnouncementFeatured
2025 Annual Digital Performance Report
A detailed review of the audience growth, reach, and engagement that defined Dzaleka Online Services' digital presence throughout 2025.
Bakari Mustafa
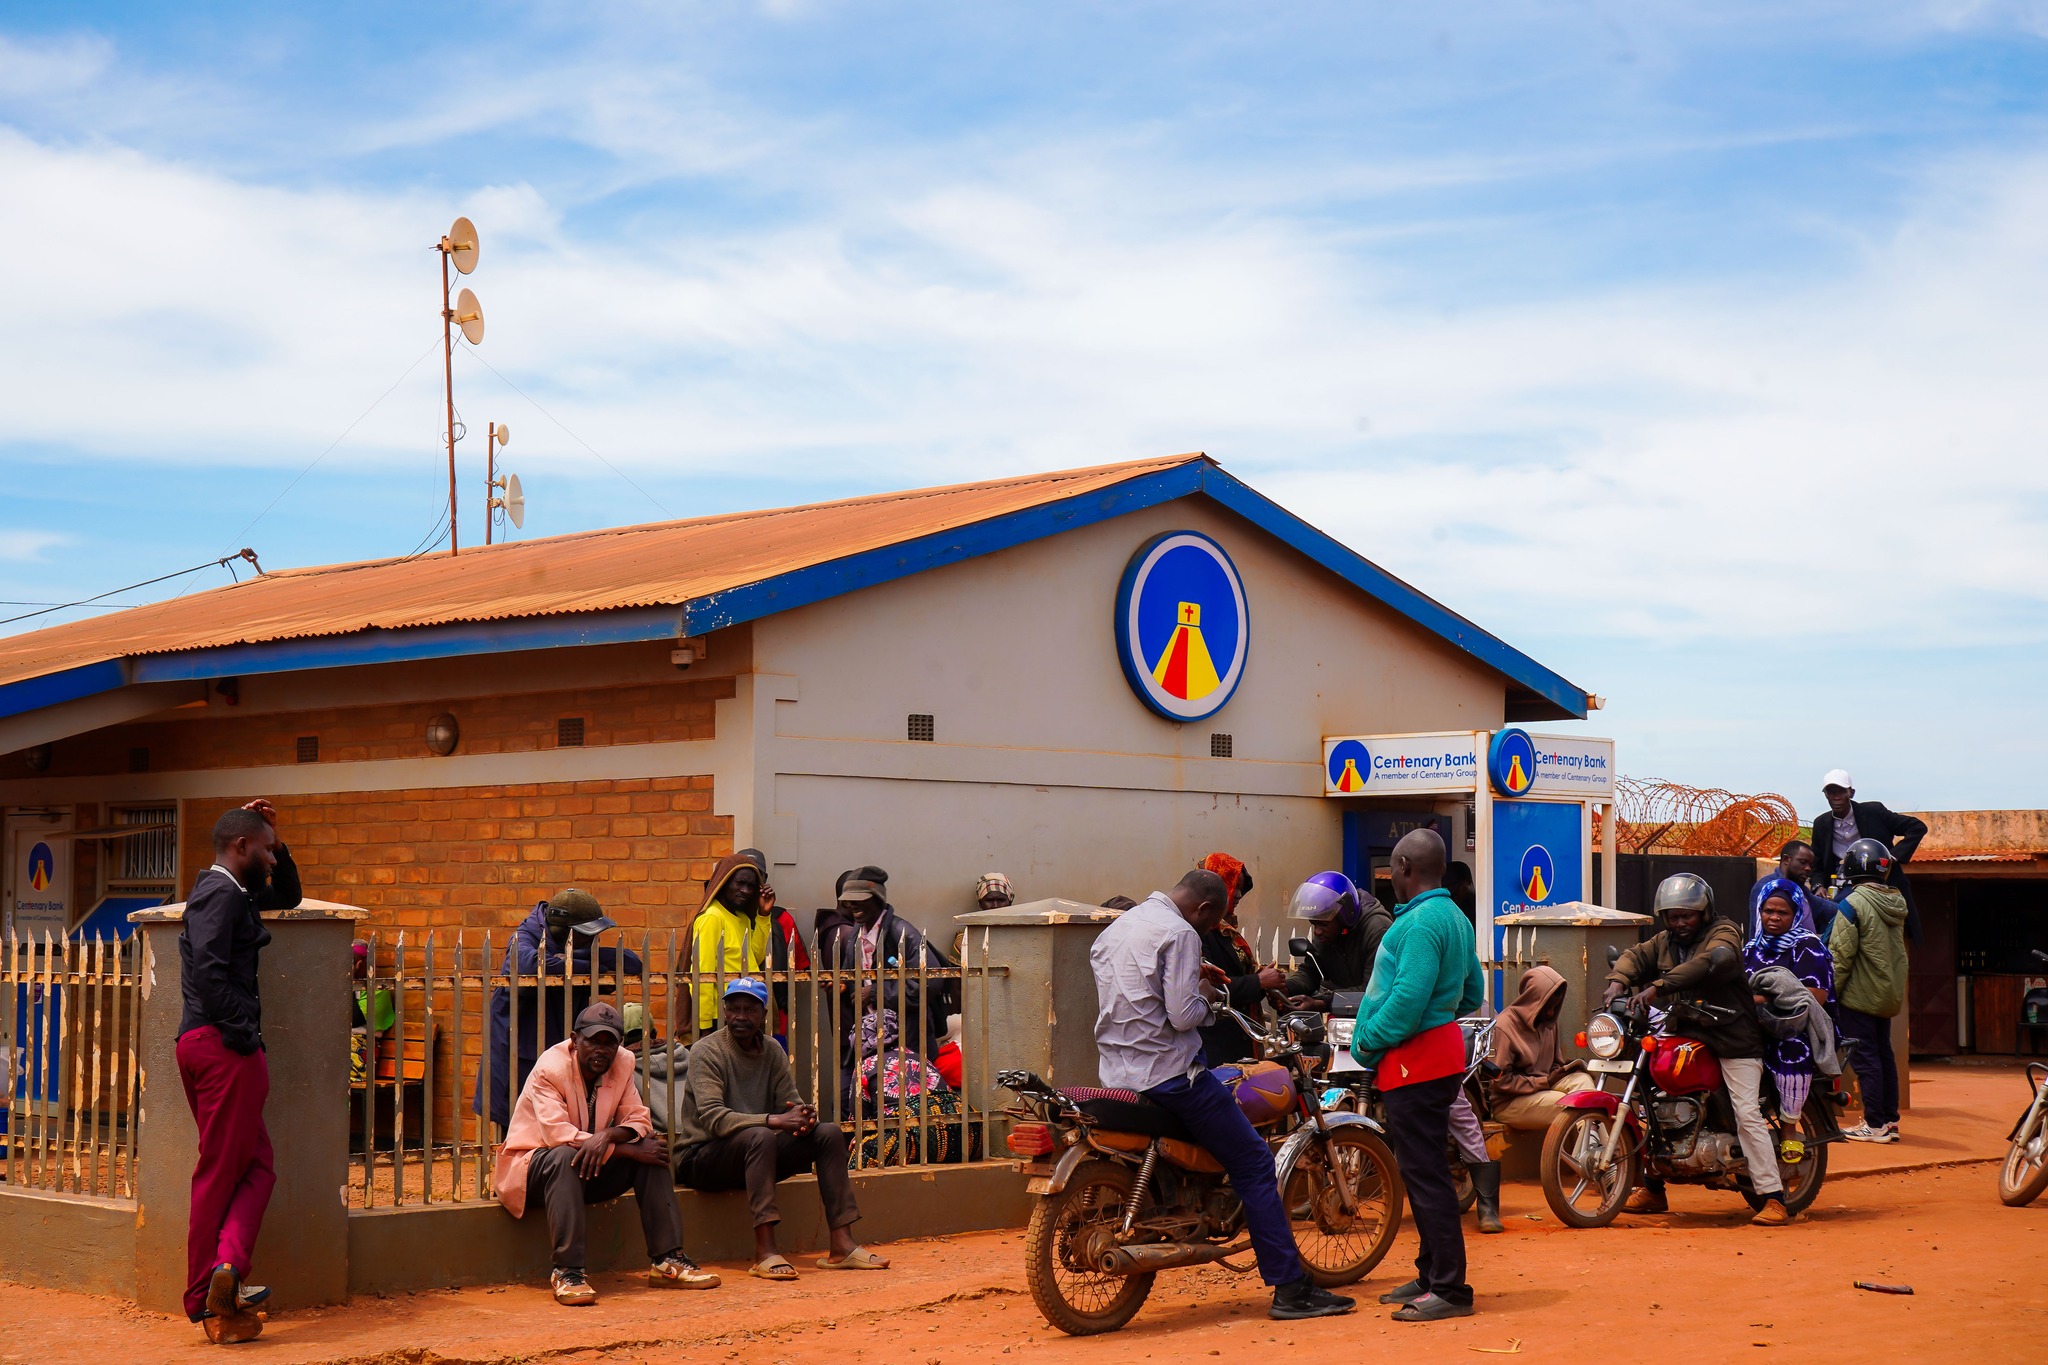
Image credit: Inua Advocacy
Throughout 2025, we worked to establish Dzaleka Online Services as a reliable digital bridge for our community and partners. This report summarizes our growth, how people discovered our platform, and what content mattered most from January 1 to December 31, 2025.
1. Executive Summary: Annual Reach
In 2025, Dzaleka Online Services reached a total of 17,952 active users. These users accounted for 22,434 sessions, showing that both new and returning visitors are consistently using our digital resources to find information and opportunities.
Key Performance Indicators (Jan 1 – Dec 31, 2025)
| Metric | 2025 Total |
|---|---|
| Total Active Users | 17,952 |
| Total Sessions | 22,434 |
| New Users | 17,710 |
| Returning Users | 1,697 |
2. User Growth and Engagement Trends
We saw a steady increase in activity throughout the year, with our highest engagement recorded in the final quarter.
- Reaching New People: The majority of our audience consisted of New Users (17,710), reflecting our efforts to reach more people and expand our community presence.
- Returning Community: We maintained a core group of 1,697 Returning Users who regularly check the platform for updates and resources.
- Peak Activity: November 2025 was our busiest month, with 4,183 active users visiting the site.
3. Traffic Sources and Acquisition
People found Dzaleka Online Services through a variety of channels, with direct visits and organic searches being the most common.
Top 5 Acquisition Channels
| Channel Group | Active Users |
|---|---|
| Direct | 8,845 |
| Organic Search | 6,248 |
| Organic Social | 1,525 |
| Referral | 1,104 |
| Unassigned | 81 |
Top External Referring Sites
Beyond search engines, social media and newer AI-driven tools were the main ways people were referred to our site.
| Referring Site | Sessions |
|---|---|
| m.facebook.com | 740 |
| facebook.com | 451 |
| viikqoye.com | 317 |
| chatgpt.com | 280 |
| l.instagram.com | 199 |
4. Geographic Reach
Our platform reached a global audience in 2025, with major activity centered in Malawi, the United States, and China.
Top 10 Countries by Performance
| Rank | Country | Active Users | Sessions |
|---|---|---|---|
| 1 | United States (US) | 4,000 | 4,554 |
| 2 | China (CN) | 3,728 | 3,716 |
| 3 | Malawi (MW) | 3,705 | 5,267 |
| 4 | Singapore (SG) | 2,257 | 2,256 |
| 5 | India (IN) | 1,354 | 1,403 |
| 6 | Australia (AU) | 722 | 1,975 |
| 7 | Canada (CA) | 602 | 891 |
| 8 | South Africa (ZA) | 384 | 498 |
| 9 | United Kingdom (GB) | 345 | 525 |
| 10 | Brazil (BR) | 303 | 374 |
Local Impact: Malawi Deep Dive
In 2025, Malawi had the highest number of total sessions. This shows that residents and local partners are using the platform repeatedly to find information.
Top Cities in Malawi by Sessions:
- Lilongwe: 3,153 sessions (The leading source of local traffic)
- Blantyre: 2,091 sessions
- Other/Unset: 99 sessions
Malawi Traffic Trends: Local traffic from Malawi grew steadily throughout the year. Activity was highest in August 2025 with 751 sessions and remained stable through the end of the year.
Key Geographic Insights
- High Local Engagement: While we had more unique users in the US, people in Malawi generated the most total sessions (5,267). This suggests that local users rely on the site as a regular resource they return to often.
- Global Diaspora: Strong engagement from the US, Australia, and Canada shows our connection with the Dzaleka diaspora and international partners.
- International Business Hubs: High performance in China and Singapore highlights the platform’s reach in major information centers.
5. Content and Resources Performance
Practical guides and community information were the most visited parts of our site:
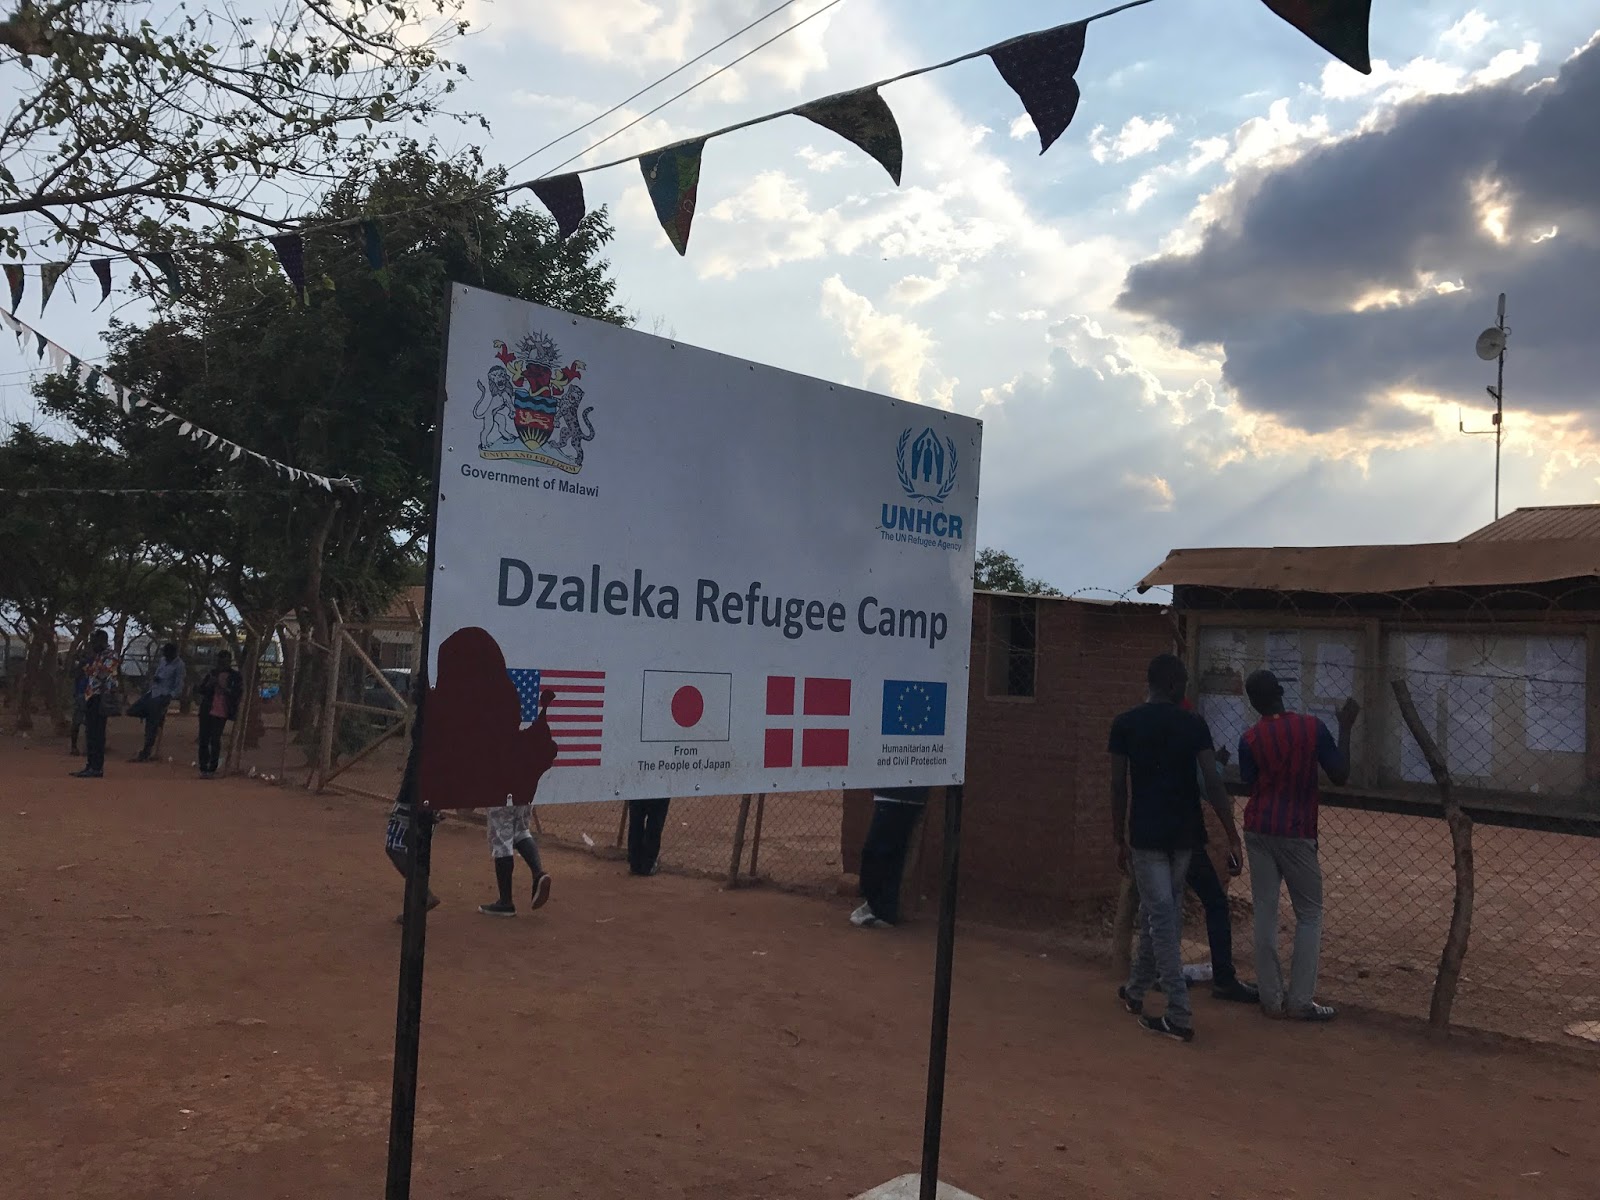
- The Main Hub: Our homepage remains the primary starting point with 2,901 users.
- Essential Information: The Dzaleka Refugee Camp guide (1,614 users) and our business registration guide (1,552 users) were our top-performing resources.
- Service Hubs: People also regularly used our community services directory and knowledge hubs to find support and learn.
6. Technical Access & Device Usage
Dzaleka Online Services is accessed through a variety of hardware, with desktop users slightly outnumbering mobile users in 2025.
| Device Category | Active Users |
|---|---|
| Desktop | 10,382 |
| Mobile | 7,399 |
| Tablet | 150 |
7. Global Language Distribution
While English is the primary language of our audience, we observed significant engagement from users speaking a variety of other languages, especially those common in our region.
| Language | Active Users |
|---|---|
| English | 16,486 |
| Chinese | 346 |
| French | 262 |
| Portuguese | 227 |
| German | 155 |
| Dutch | 70 |
| Spanish | 66 |
| Hindi | 54 |
| Italian | 47 |
| Japanese | 29 |
8. Engagement & Interaction
Our community is highly engaged with our content, with users spending an average of 2 minutes and 36 seconds per session.
- Content Depth: With nearly 3 page views per user, it is clear that once someone arrives on the platform, they find the information valuable enough to explore multiple resources.
- Active Interactions: Beyond reading, we saw over 13,900 scroll events and nearly 2,000 clicks on interactive buttons and links.
- Growing our Reach: Our newsletter modal was viewed 3,302 times, showing a strong interest in staying connected.
9. Conclusion and 2026 Focus
2025 was a year of growth for Dzaleka Online Services. The data reveals that we are meeting our goal of being a primary source for community and business information for people in Malawi and around the world.
As we move through 2026, we are focusing on these key strategic areas:
- Mobile Optimization: With nearly 40% of our users on mobile, we are ensuring that our most critical resources—like the refugee camp guide and business registration portal—are perfectly optimized for smaller screens.
- Multilingual Support: The presence of French and Portuguese speakers suggests a high-impact opportunity for targeted content translation, helping us better serve the diverse linguistic groups within Dzaleka and the surrounding region.
- Improved Impact Tracking: We are refining how we track the outcomes of our services to ensure we continue to meet the evolving needs of our community.
This report covers our activity across the 2025 fiscal year.
Topics
Tags
#Annual Report#Digital Performance#Audience Growth#2025
Continue reading
More news
AnnouncementFeatured
Dzaleka Online Services Team
Introducing the Dzaleka Encyclopedia
A new sourced reference brings together Dzaleka's history, people, institutions, culture, services, law, health, education, infrastructure, and public life.
Read article
AnnouncementFeatured
Dzaleka Online Services
Introducing DzalekaPay Beta
DzalekaPay beta brings payment links, QR payments, storefronts, event tickets, campaign pages, and merchant records to sellers and organisers in Dzaleka.
Read article
AnnouncementFeatured
Dzaleka Online Services
Announcing the launch of the new Dzaleka Wellbeing Hub
Dzaleka Online Services has launched a completely redesigned mental health platform, moving away from academic reporting to prioritize immediate crisis support and practical caregiver resources.
Read article